This seminar was quite an enlightening experience as I have never created a infographic before. The unique purpose of this, was that there was no limitation to what we could make, as long as we recorded information and did it visually rather than using statistical numbers. I have noticed infographics becoming much more popular with creative CV's as it breaks down the text so that the employer easily see the information and much more clearly, having a bigger impact. Another way I know how infographics are used are within magazines, usually business related so that they can show statistics much more clearly.
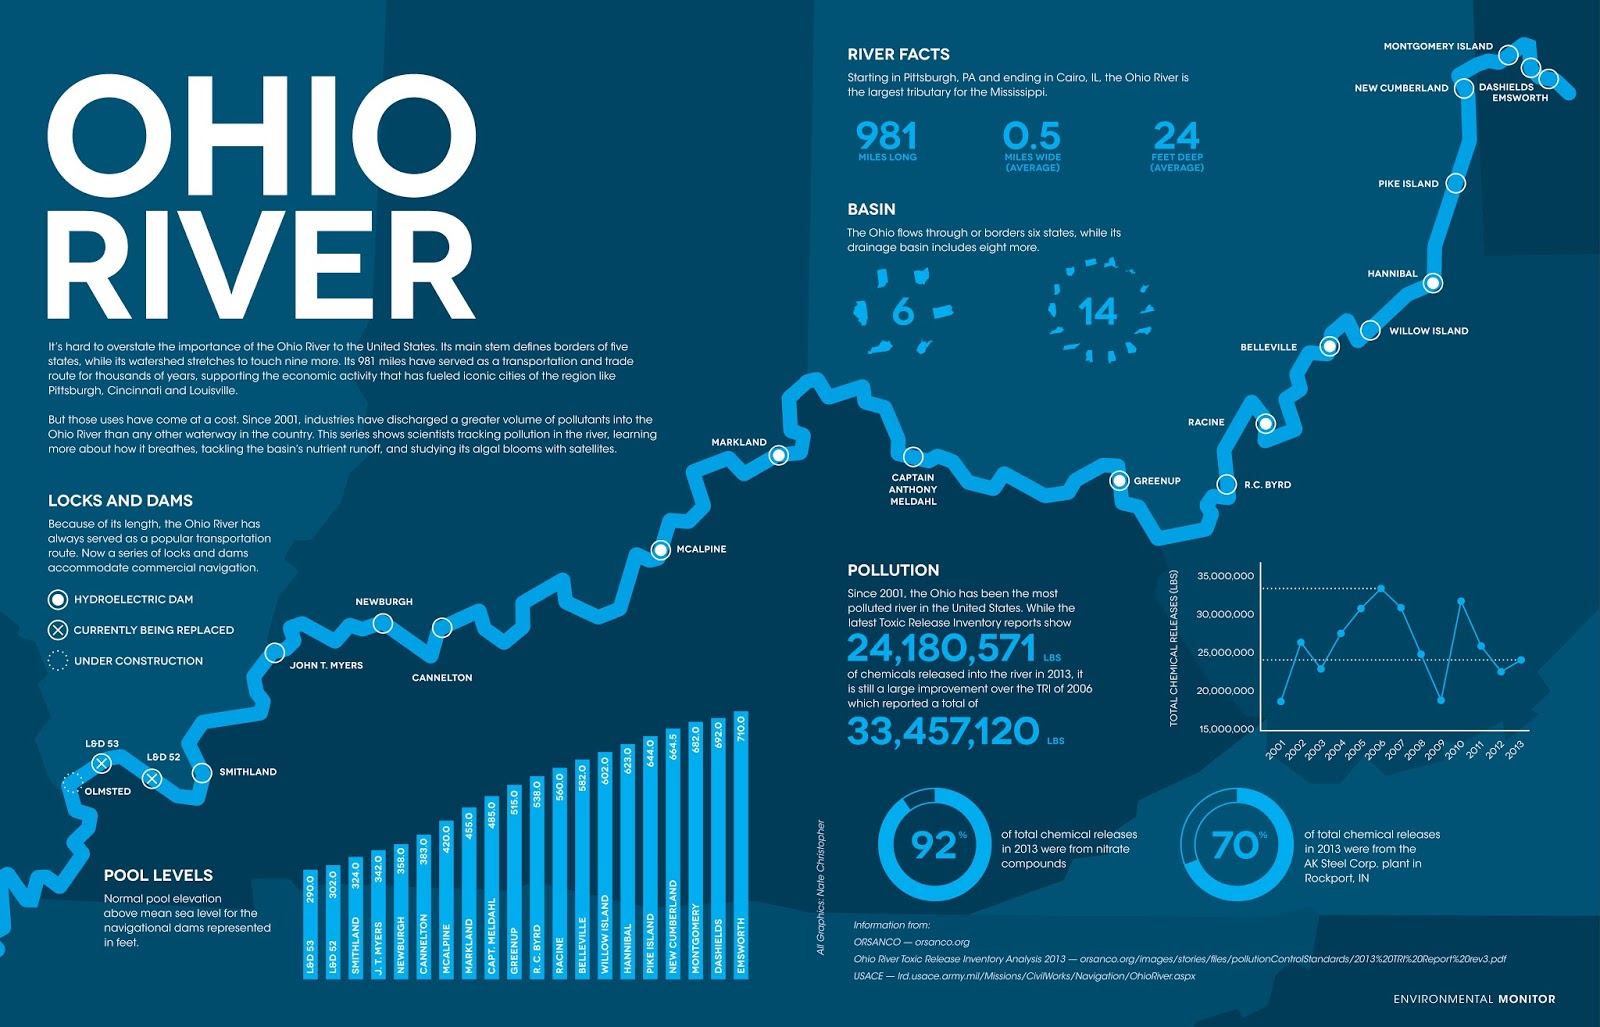
Image of an infographic Poster
I really enjoyed this seminar, as we were give a fun and enjoyable task to take part in and experiment with out to transfer statistical information in to a graph and produce it much more visually.